epitopefindr Application: Viral Peptides
Brandon Sie
2024-05-03
epitopefindr_avarda_vignette.RmdIntroduction
This vignette provides a walthrough of using
epitopefindr to process an example dataset included with
the package, epitopefindr::pairwise_viral_hits.
The dataset has been previously explored by Monaco et al. Biorxiv and describes a set of phage-displayed peptide sequences for which the patient’s antibody specificity demonstrated a statistically significant change when comparing the patient’s data from the PhIP-seq assay.
epitopefindr may be useful to look for sequence
similarity among these enriched peptides as a step towards identifying
critical sequence motifs.
Loading the Data
We can see that pairwise_viral_hits is a
Biostrings::AAStringSet object consisting of the 159 pairwise enriched
peptides. These peptides have been annotated with taxonomic and protein
name information. This is our input to epitopefindr.
library(epitopefindr)
library(magrittr)
epitopefindr::pairwise_viral_hits
epitopefindr::pairwise_viral_hits
#> AAStringSet object of length 159:
#>       width seq                                             names
#>   [1]    56 GWTVQAVEVVENFLPVPGSTMD...HPSFAGLIDPSLDQEDFNAVLD Phlebovirus_Sandf...
#>   [2]    56 YPRQMMHPSFAGLIDPSLDQED...FMFSKTINVSLRGAQKRDIEES Phlebovirus_Sandf...
#>   [3]    56 GLRTSGEEVEELEYERLISSLS...LAVKERGLPYKVRLEKALMSGI Mammarenavirus_Pi...
#>   [4]    56 MADEALYVYLEGPGATLPEQQQ...TLYPRGVALLSLRLSIIIPRGY Mastadenovirus_Hu...
#>   [5]    56 IGEFSQEGYLLRPRLAKTELYF...VLEHTRDQLLSVGDVFDESRMA Parapoxvirus_Pseu...
#>   ...   ... ...
#> [155]    56 MEPRPGASTRRPEGRPQREPAP...DSIYSEADTEVGGRGDLRPPLT Simplexvirus_Huma...
#> [156]    28 PIIATSDPTPRRDAATKSRRRRPHSRRL                    Simplexvirus_Huma...
#> [157]    56 TKKGTSYPKLSKSYTNNKGKEV...SEQQSLYQNADAYVSVGSSKYN Influenzavirus A_...
#> [158]    56 TKKGTSYPKLSKSYTNNKGKEV...SEQQTLYQNVDAYVSVGSSKYN Influenzavirus A_...
#> [159]    56 MDVLSKSSLKELLAHLERTPLE...QNVLISRNEYYNQPYPDVTSLI Seadornavirus_Ban...
names(epitopefindr::pairwise_viral_hits)[1]
#> [1] "Phlebovirus_Sandfly fever sicilian virus_Nucleocapsid_1297"
Run epitopefindr
The all-in-one wrapper for running epitopefindr is
epfind. At its most basic, epfind takes two
input parameters, (1) a set of named peptides, either as an AAStringSet
object or as a directory path to a .fasta file that can be read by
Biostrings::readAAStringSet, and (2) a path to which output files can be
written. More parameters for customization are documented at
?epfind.
output.dir <- "AVARDA_vignette_data/"
msa.path <- paste0(output.dir,"/msa.pdf")

if(!file.exists(msa.path)){
  epitopefindr::epfind(epitopefindr::pairwise_viral_hits, output.dir,
                       e.thresh = 0.0001, min.groupsize = 6)
  unlink(paste0(output.dir,"intermediate_files"), recursive = TRUE, force = TRUE)
}
Investigate Sequence Alignment Logos
We can print some of the sequence motifs from this output. Consider
MSA 11 as an example. This 18 amino acid motif is represented in 7 of
our input peptides. Many of these positions are fully conserved, but
positions 3, 5, and 17 are only partially conserved. This illustrates
that epitopefindr makes use of BLAST to retain evidence for
certain motifs that would be discarded with a gapped k-mer approach.
#convert pdf to png
print.range <- 11

imgdir <- paste0(output.dir,"/png/")
if(!dir.exists(imgdir)) dir.create(imgdir)
imgnames <- paste0(imgdir,"msa-",print.range,".png")

pdftools::pdf_convert(msa.path, format = "png", pages = print.range,
                      filenames = imgnames, verbose = FALSE)
#> Warning in sprintf(filenames, pages, format): 2 arguments not used by format
#> 'AVARDA_vignette_data//png/msa-11.png'
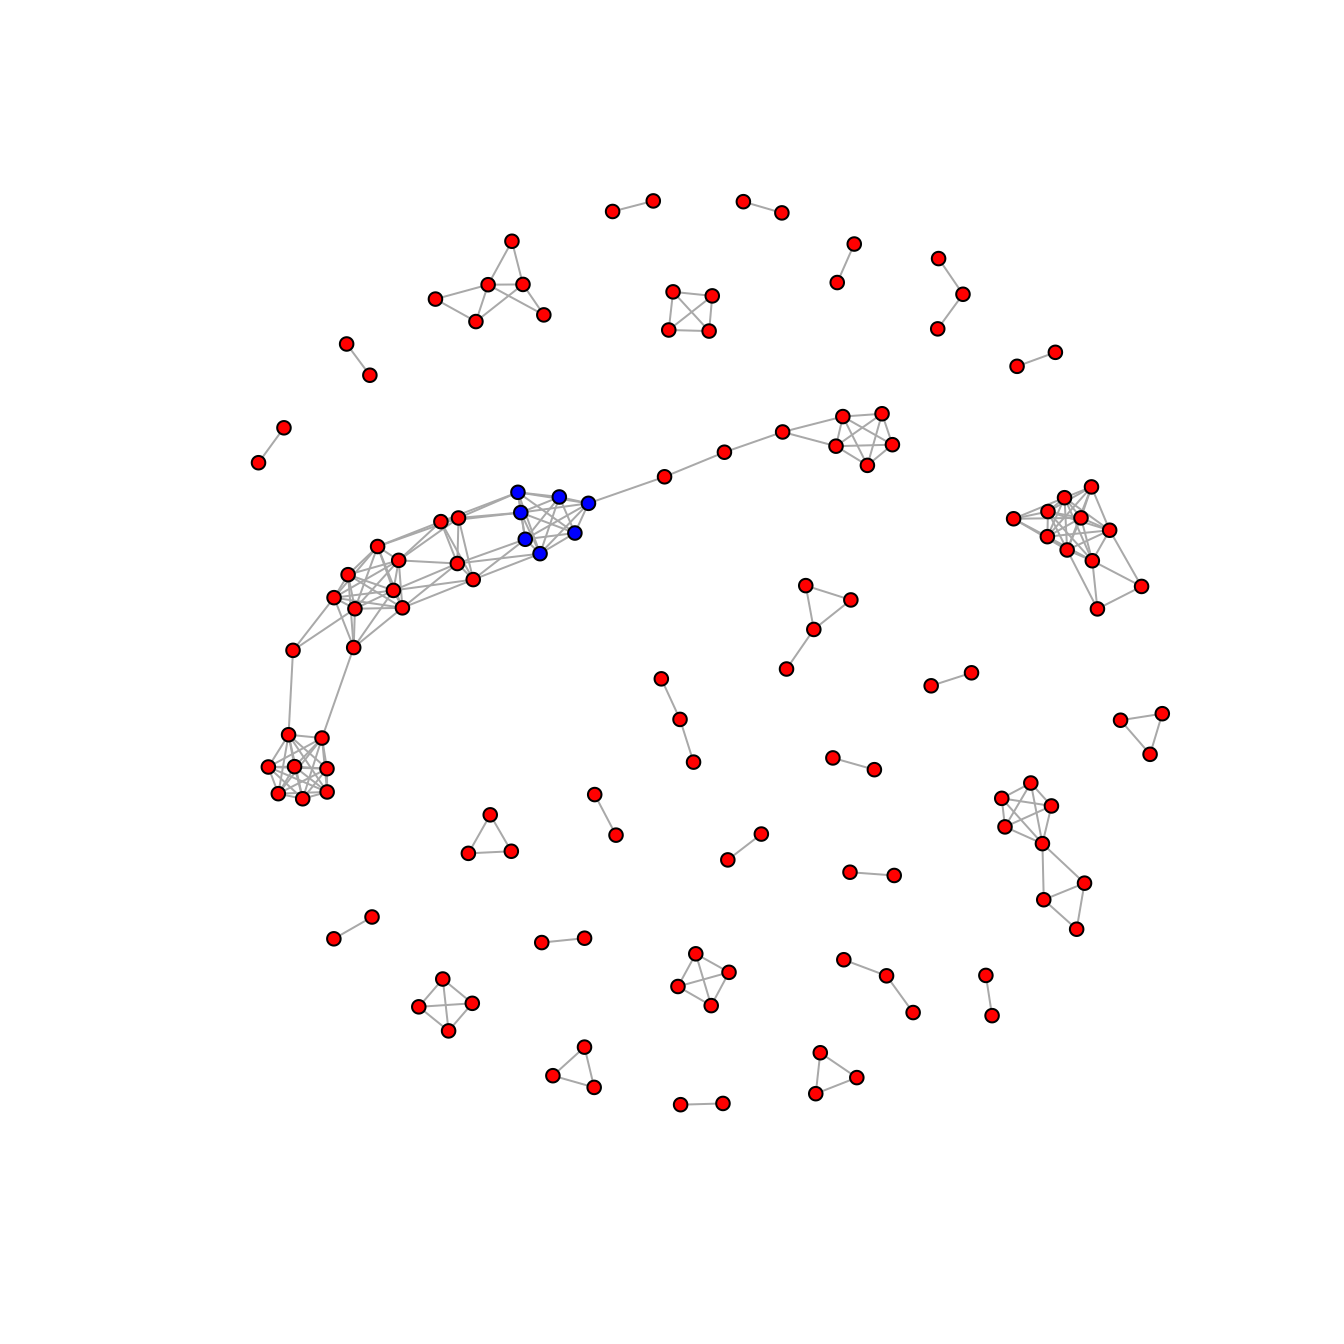
Network Graph
The output of epitopefindr can be fed into network
graphing. Each vertex represents a fragment of an input sequence. Each
link represents an alignment between two peptide fragments. Group 11 is
highlighted in blue.
aln <- data.table::fread(paste0(output.dir,"/finalAlignments.csv"))
ver <- data.table::fread(paste0(output.dir,"/epitopeSummary.csv"), header = TRUE)

g11 <- ver[,c("id","11")]
g11 <- g11[!grep("NA$",g11$id),]
g11$color <- ifelse(g11$`11` == "", "red","blue")

set.seed(1)
g <- igraph::graph_from_data_frame(aln[,1:2], directed = FALSE, vertices = g11) %>%
  (igraph::simplify) %>% plot(vertex.label = NA, vertex.size = 3,
                              arrow.size = 0, vertex.color = g11$color)